Below is a news release from the Idaho Department of Fish and Game.
Fish and Game wildlife biologists are often asked “how does the deer/elk count look in Unit X?” While this may seem like a simple question, answering it can be difficult and expensive to quantify, but biologists have a variety of tools for monitoring herds and tracking population changes.
Many people assume biologists conduct deer and elk counts every year in each of Fish and Game’s 99 hunt units. That’s understandable, but there are many factors that influence how often population counts can occur across the state.
Population surveys take a significant amount of time, personnel hours and resources. Combining the personnel costs with very expensive hourly costs for helicopter flight time – which often runs thousands of dollars per day – the total cost can easily exceed the annual budget allocated for population monitoring.
Due to high costs of helicopter time, biologists must design and plan a survey to ensure quality data is collected and also decide how high the helicopters fly, at what speed and what specific elevation contour intervals. Add ever-changing weather and snow conditions, which affect how much animals are congregated on the landscape and how easy they are to spot, and what seems like a straight-forward task can be extremely difficult to complete.
Hunters are often interested in one particular game management unit — or hunt units, as they are commonly known — and typically the one they hunt. But data collected from radio-collared mule deer show some winter ranges contain deer that migrate from summer ranges across many different hunt units. Understanding these seasonal movements led to the development of more biologically meaningful collection of data, or what biologists refer to as Data Analysis Units.
Each DAU includes information about both summer and winter ranges, as well as migratory routes for deer populations, which collectively are used as the sampling unit to manage deer populations.
DAUs are created so deer survival, recruitment, mortality and harvest rates are similar throughout the DAU and across all seasons, so what happens in one unit generally represents what happens in the entire deer population within several hunt units.
Abundance surveys estimate herd sizes
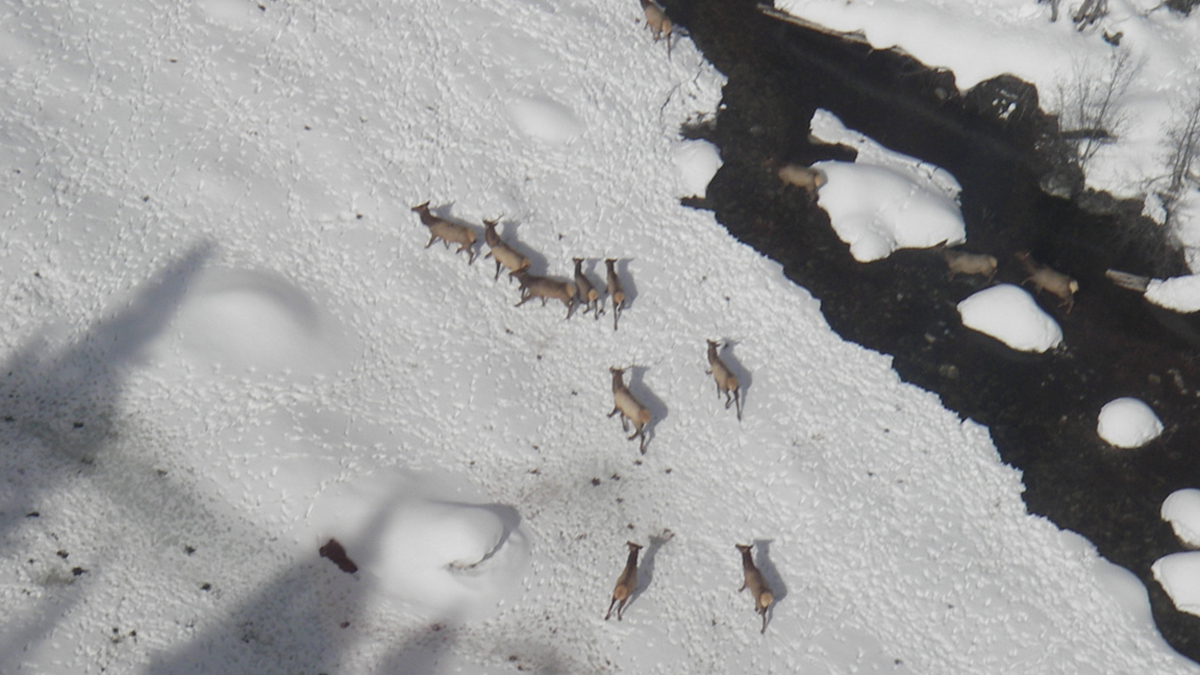
An “abundance survey” includes counting deer or elk within a specific DAU by flying a grid across all winter ranges within that DAU. Normally, these surveys are done with a helicopter every four to five years.
A typical abundance survey may take several weeks to survey the entire DAU, and they are typically flown between mid-January and early March to ensure deer are concentrated on low-elevation winter ranges.
Biologists know they won’t spot every animal while flying over various terrain and counting deer, elk and other animals, so they have a way to account for those “missing” animals. Fish and Game researchers developed a “sightability model” that corrects the count to include wildlife not observed.
The model was developed because it is nearly impossible to count every animal on a given flight. It was originally developed by flying over an area and counting the animals, then having a ground crew go back and intensively search the area and compare counts to between the two methods to see how many animals were missed and create a formula to account for it.
A survey might observe 10,000 deer on a winter range, but the sightability model will correct the estimate for those deer not seen, which could increase the estimate in the 11,000 -13,000 range.
The sightability model is designed to account for varying factors, such as snow cover, deer group size, number of deer found in heavy cover, etc. For example, the sightability model would be different in flat, open terrain than it would in a steep canyon with lots of cover.
Not every DAU in the state is surveyed for several reasons, such as, they have very low densities of animals, or the animals are widely dispersed across the area. Some are simply too vast, so it would be cost prohibitive to survey them, and others may not have winter ranges where animals congregate and biologists could count them.
Using modeling to estimate abundance between surveys
If Fish and Game staff only counts animals in the field once every four to five years, how do they know how many animals there are in years between surveys? After all, five years can be a long time, especially when populations fluctuate significantly from year to year due to weather and other factors.
The equation is complicated, but the answer is in mathematics and experience.
For mule deer populations, Fish and Game researchers have developed a robust mathematical formula, called an “integrated population model,” which allows them to reliably estimate abundance from year to year between actual surveys.
The integrated population model combines various sets of data — and lots of them — that biologists collect and continue to update annually, including information gleaned from monitoring fawns and does wearing tracking collars, satellite images that allow them to assess localized weather and habitat conditions, age and sex ratios from annual herd composition surveys (more on that later) and harvest data.
When the abundance surveys are flown again, it’s a chance to check the math and ground-truth the population modeling, and typically, the two numbers are pretty close. As Fish and Game researchers have continued to refine the formula over the years, the modeling has steadily improved.
“Our integrated population modeling, at this point, is probably more accurate than our actual aerial abundance surveys because the model relies on several streams of data instead of a single estimate,” said Mark Hurley, Fish and Game’s wildlife research manager. “With the modeling, there is much lower potential for a single instance of weather, or animal behavior, to influence the result.”
In addition to continually refining the integrated population model for Idaho’s mule deer herds, Fish and Game researchers are currently developing a similar model for elk. Because the two animals are different, the population model must be as well.
“We simply don’t have the long-term data stream we have with mule deer. But we’re working on improving those data streams,” Hurley added. “As a part of that process, we’ve had to develop new ways to overcome obstacles that are unique to collecting data about elk populations. But at this point, we’re very close to rolling that out.”
Herd composition survey
A herd composition survey is performed annually in many DAUs across the state. These surveys typically require fewer flight hours and are typically flown in early December to estimate the ratios of fawns to does and bucks to does. Early winter fawn:doe ratios measure fawn survival for the first six months of life, which is an important component to model and estimate future deer populations.
Herd composition surveys cover areas representative of the deer herd’s distribution in a given Data Analysis Unit and identify enough fawns, does and bucks to accurately estimate composition. A composition survey of 750 or 1,000 deer is fairly typical in most DAUs, and it is considered a large enough sample size to accurately estimate the composition of the entire population.
The primary purpose of a composition survey is to acquire reliable fawn:doe ratios, but buck:doe ratios are obtained at the same time. Because bucks are in smaller groups than does with fawns and occupy different areas on the landscape, a higher sample of deer is required to get a reliable buck:doe ratio. So where these ratios are important, managers spend more time surveying.
The integrated population modeling can also provide reliable estimates of buck ratios because all the data needed is already collected for the population estimates: survival of adult survival, fawn survival, and annual harvest.
Aerial surveys remain an important tool for wildlife managers
Aerial surveys are still important to estimate big game populations, and in addition to costs, flights also present considerable safety risks to Fish and Game staff and pilots. In the future, monitoring will likely be less reliant on aerial surveys due to the increasing cost of helicopter time and availability of experienced pilots with suitable helicopters.
There may come a day when Fish and Game wildlife managers no longer need to conduct helicopter surveys to double check their population modeling, or conduct herd composition surveys. Fish and Game researchers are currently developing other methods and tools to estimate big game populations, including continued and improved survival monitoring through tracking collars, and estimating abundance and herd composition by using remote cameras.
Regardless of methods, Idaho Fish and Game will always keep a watchful eye on big game herds and use the best-available technology to help them manage Idaho’s wildlife.
(Photo credit: Jen Burns/Idaho Department of Fish and Game)